Setup Guide
Add the DevFlow agent to your MAUI app in three steps. It only runs in Debug builds.
Install NuGet Packages
Add the MAUI DevFlow packages to your MAUI project. Use the .Blazor package if your app uses BlazorWebView.
# Required: Core agent
dotnet add package Microsoft.Maui.DevFlow.Agent

# Optional: Blazor WebView support (DOM, console, CDP)
dotnet add package Microsoft.Maui.DevFlow.Blazor
Tip
For macOS AppKit apps (using Platform.Maui.MacOS), the standard packages include macOS support automatically.
For Linux/GTK apps, use Microsoft.Maui.DevFlow.Agent.Gtk and Microsoft.Maui.DevFlow.Blazor.Gtk instead.
Register in MauiProgram.cs
Add the DevFlow agent registration inside a #if DEBUG block so it's never included in release builds:
public static MauiApp CreateMauiApp()
{
    var builder = MauiApp.CreateBuilder();
    builder.UseMauiApp<App>();

#if DEBUG
    // Add DevFlow agent for remote inspection
    builder.AddMauiDevFlowAgent();

    // If using BlazorWebView:
    builder.AddMauiBlazorDevFlowTools();
#endif

    return builder.Build();
}
Run Your App & Connect
Build and run your MAUI app normally. The DevFlow agent starts automatically and registers with the local broker daemon.
# Build and run on your target platform
dotnet build -f net10.0-ios -t:Run
dotnet build -f net10.0-android -t:Run
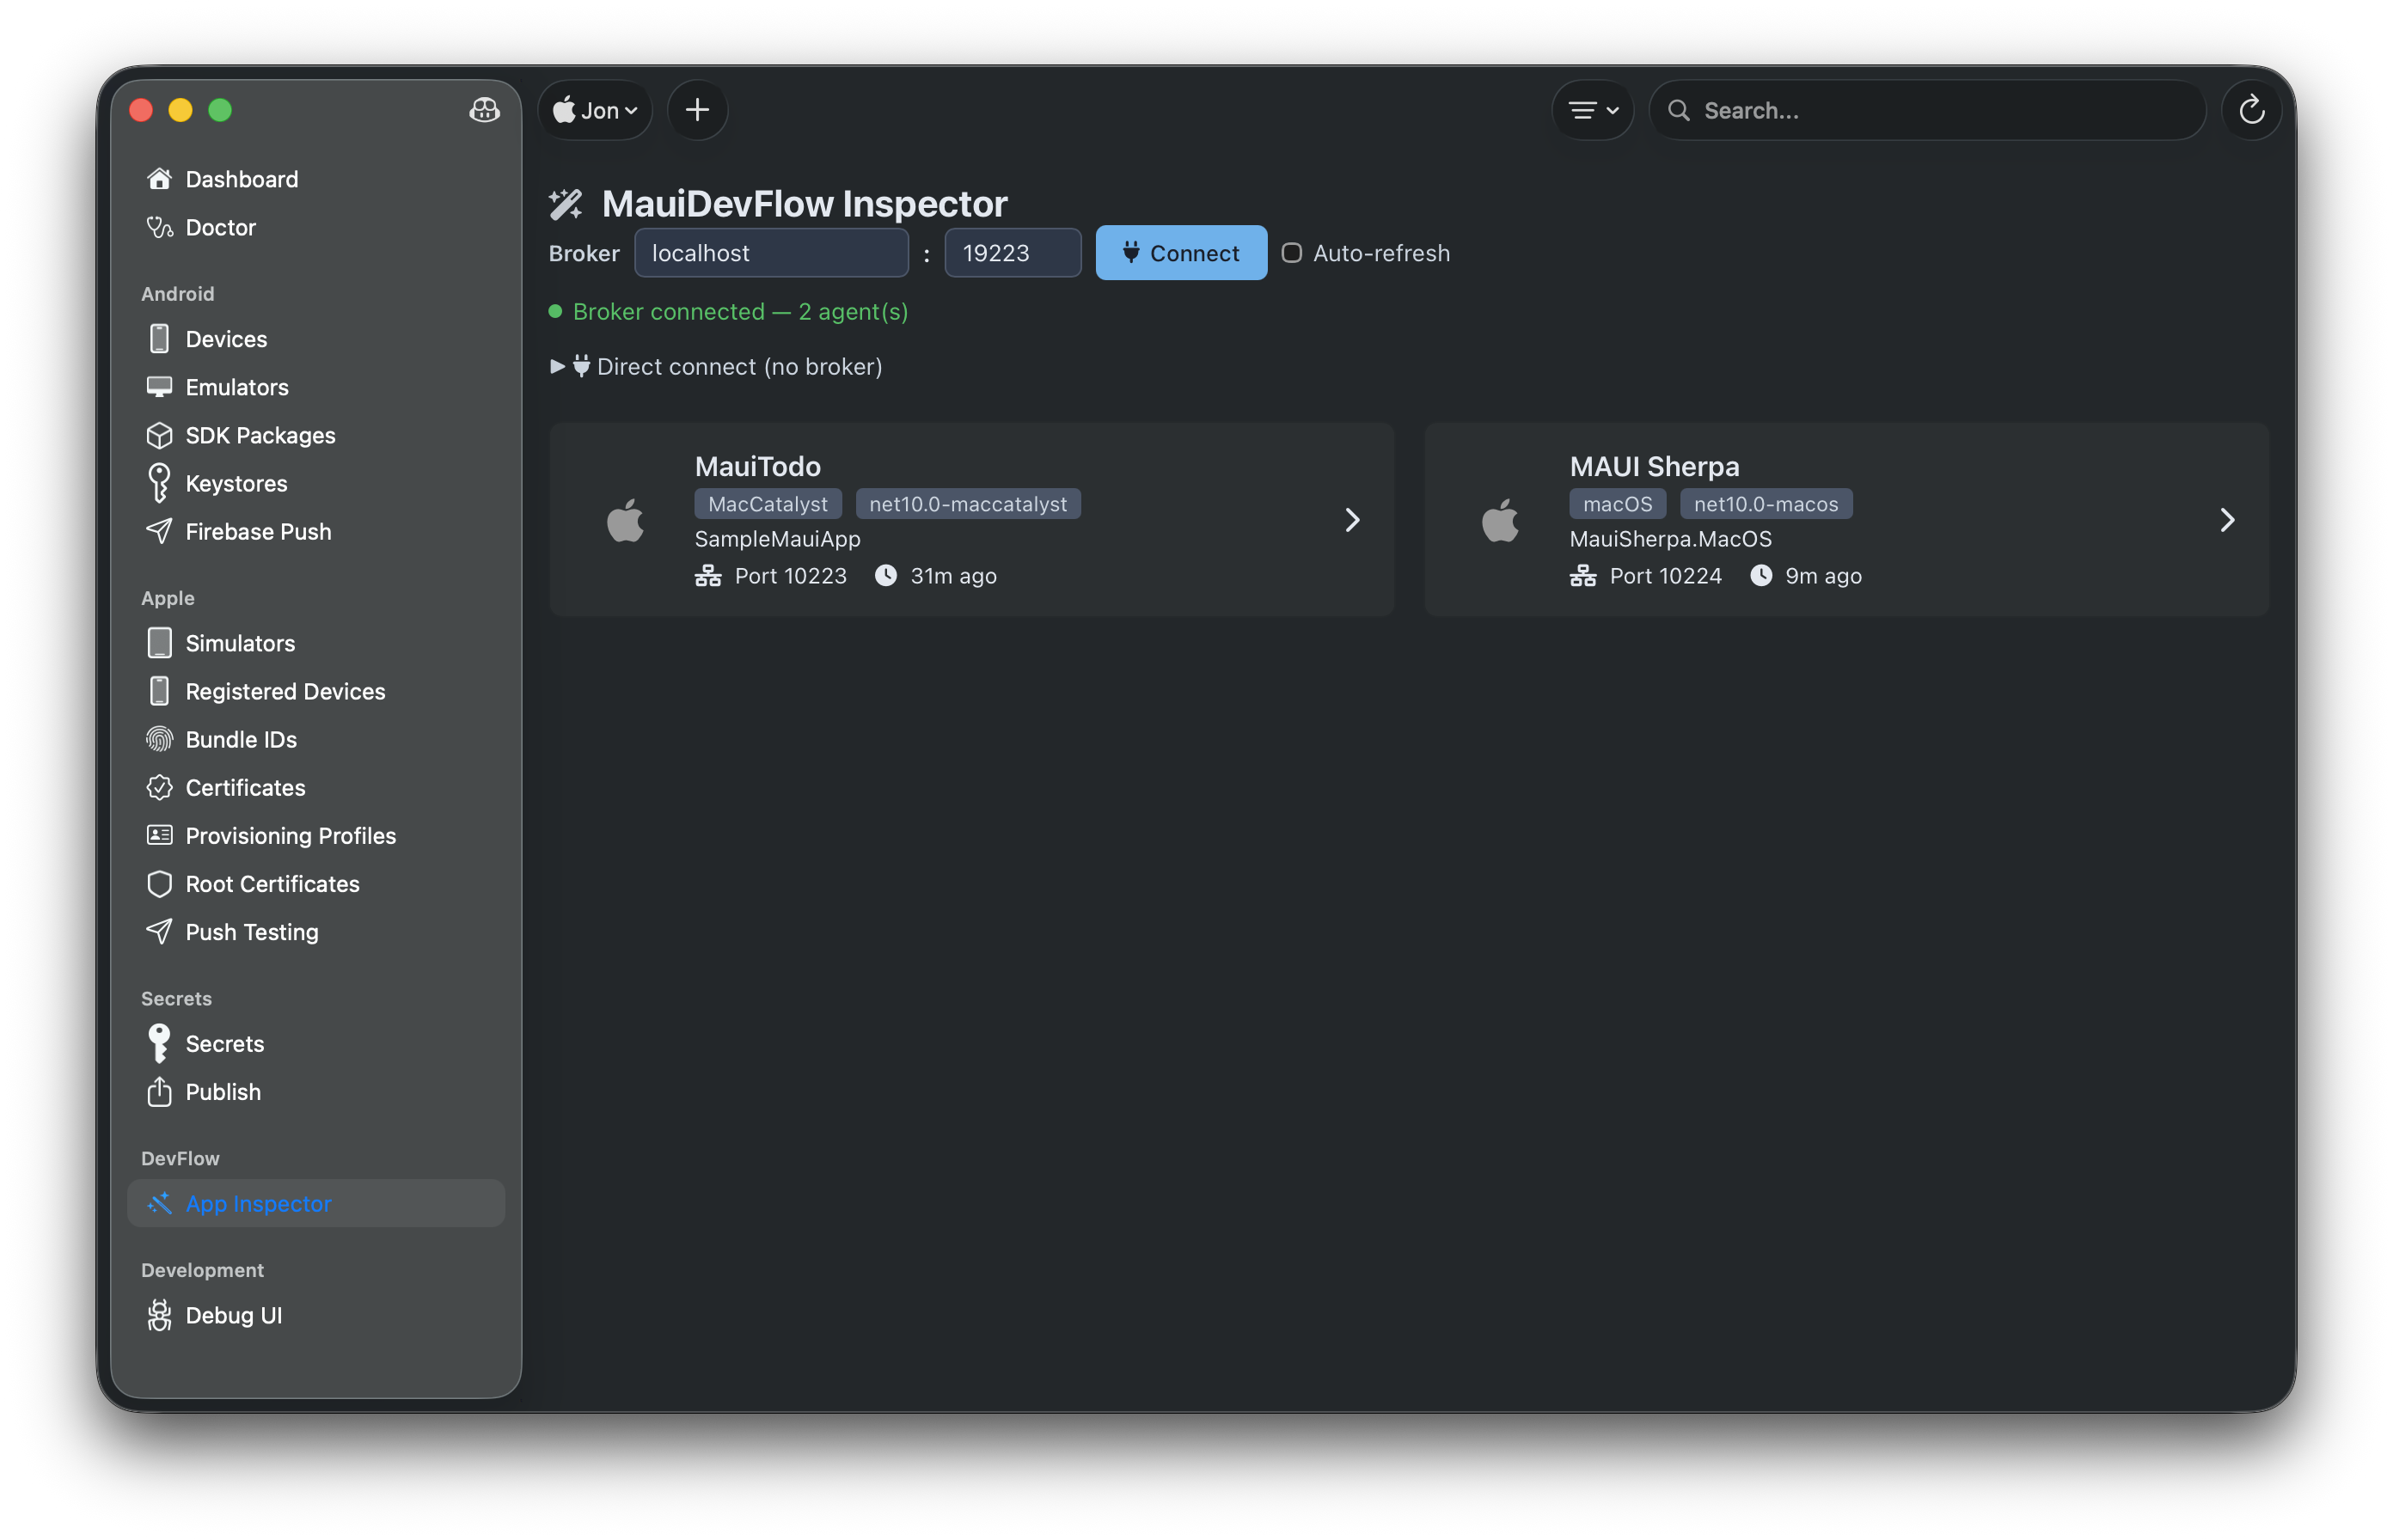
dotnet build -f net10.0-maccatalyst -t:RunThen in MAUI Sherpa:
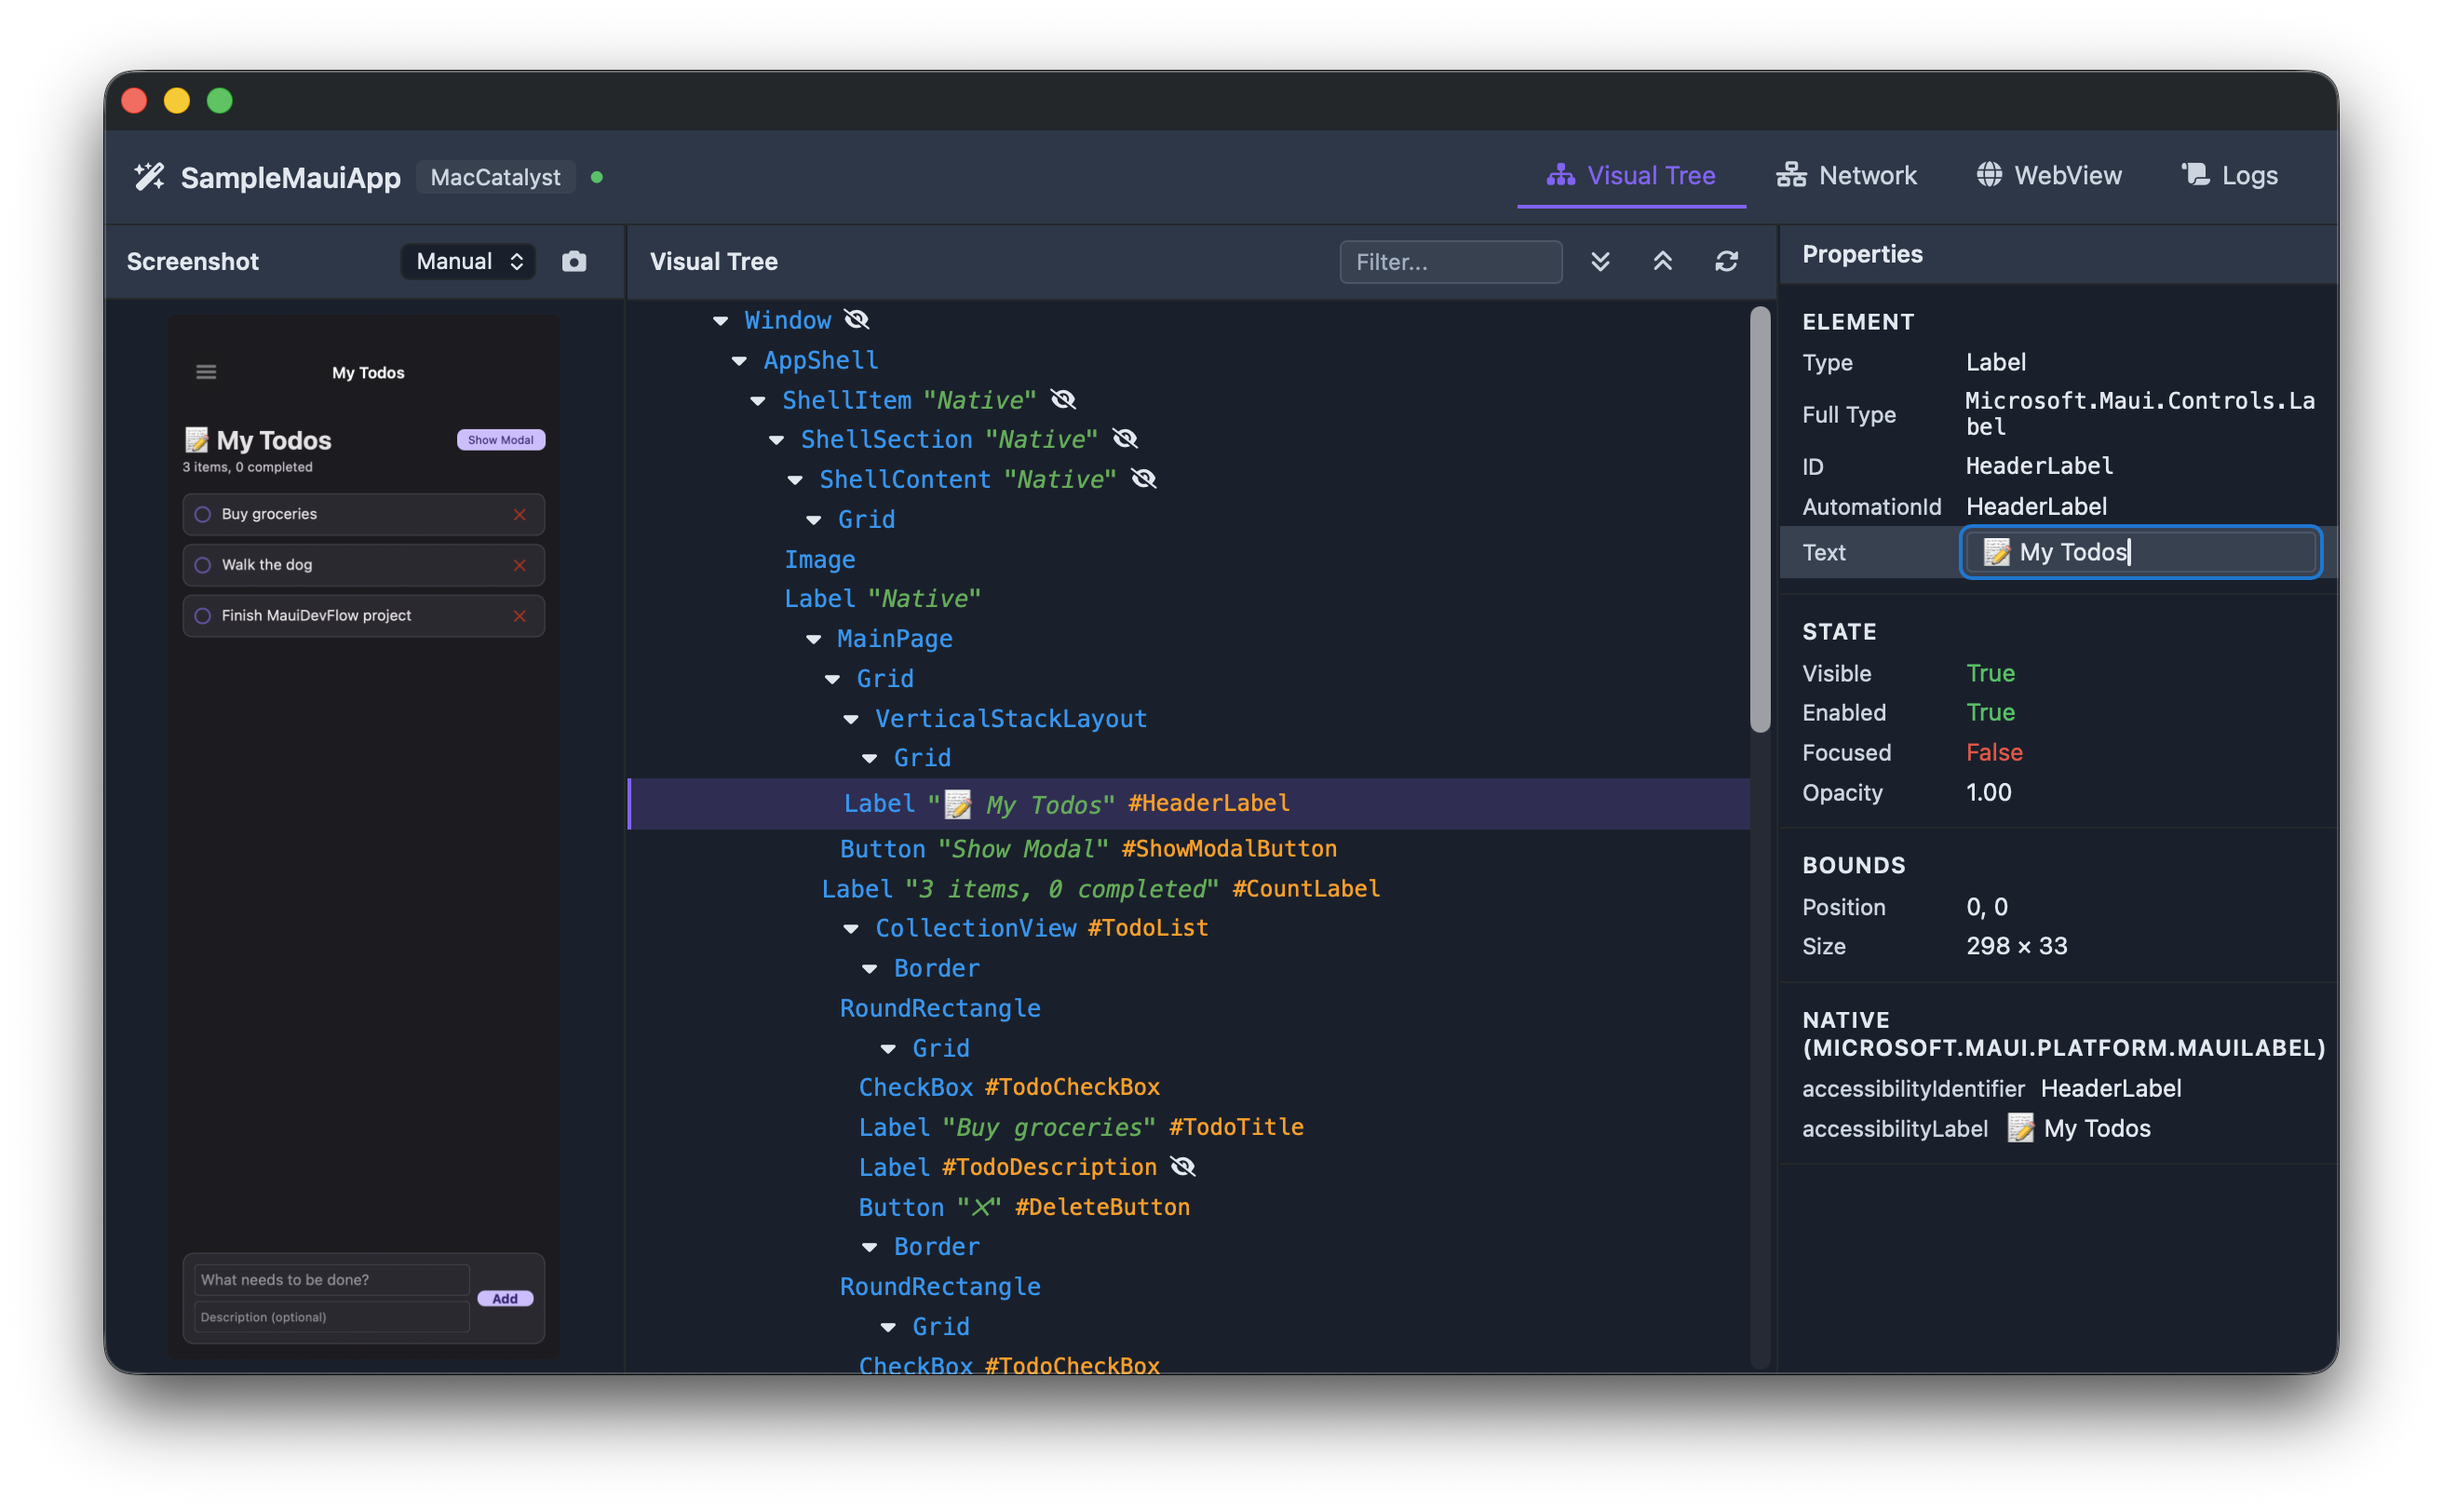
- Navigate to DevFlow in the sidebar
- Click Connect — your app should appear in the agent list
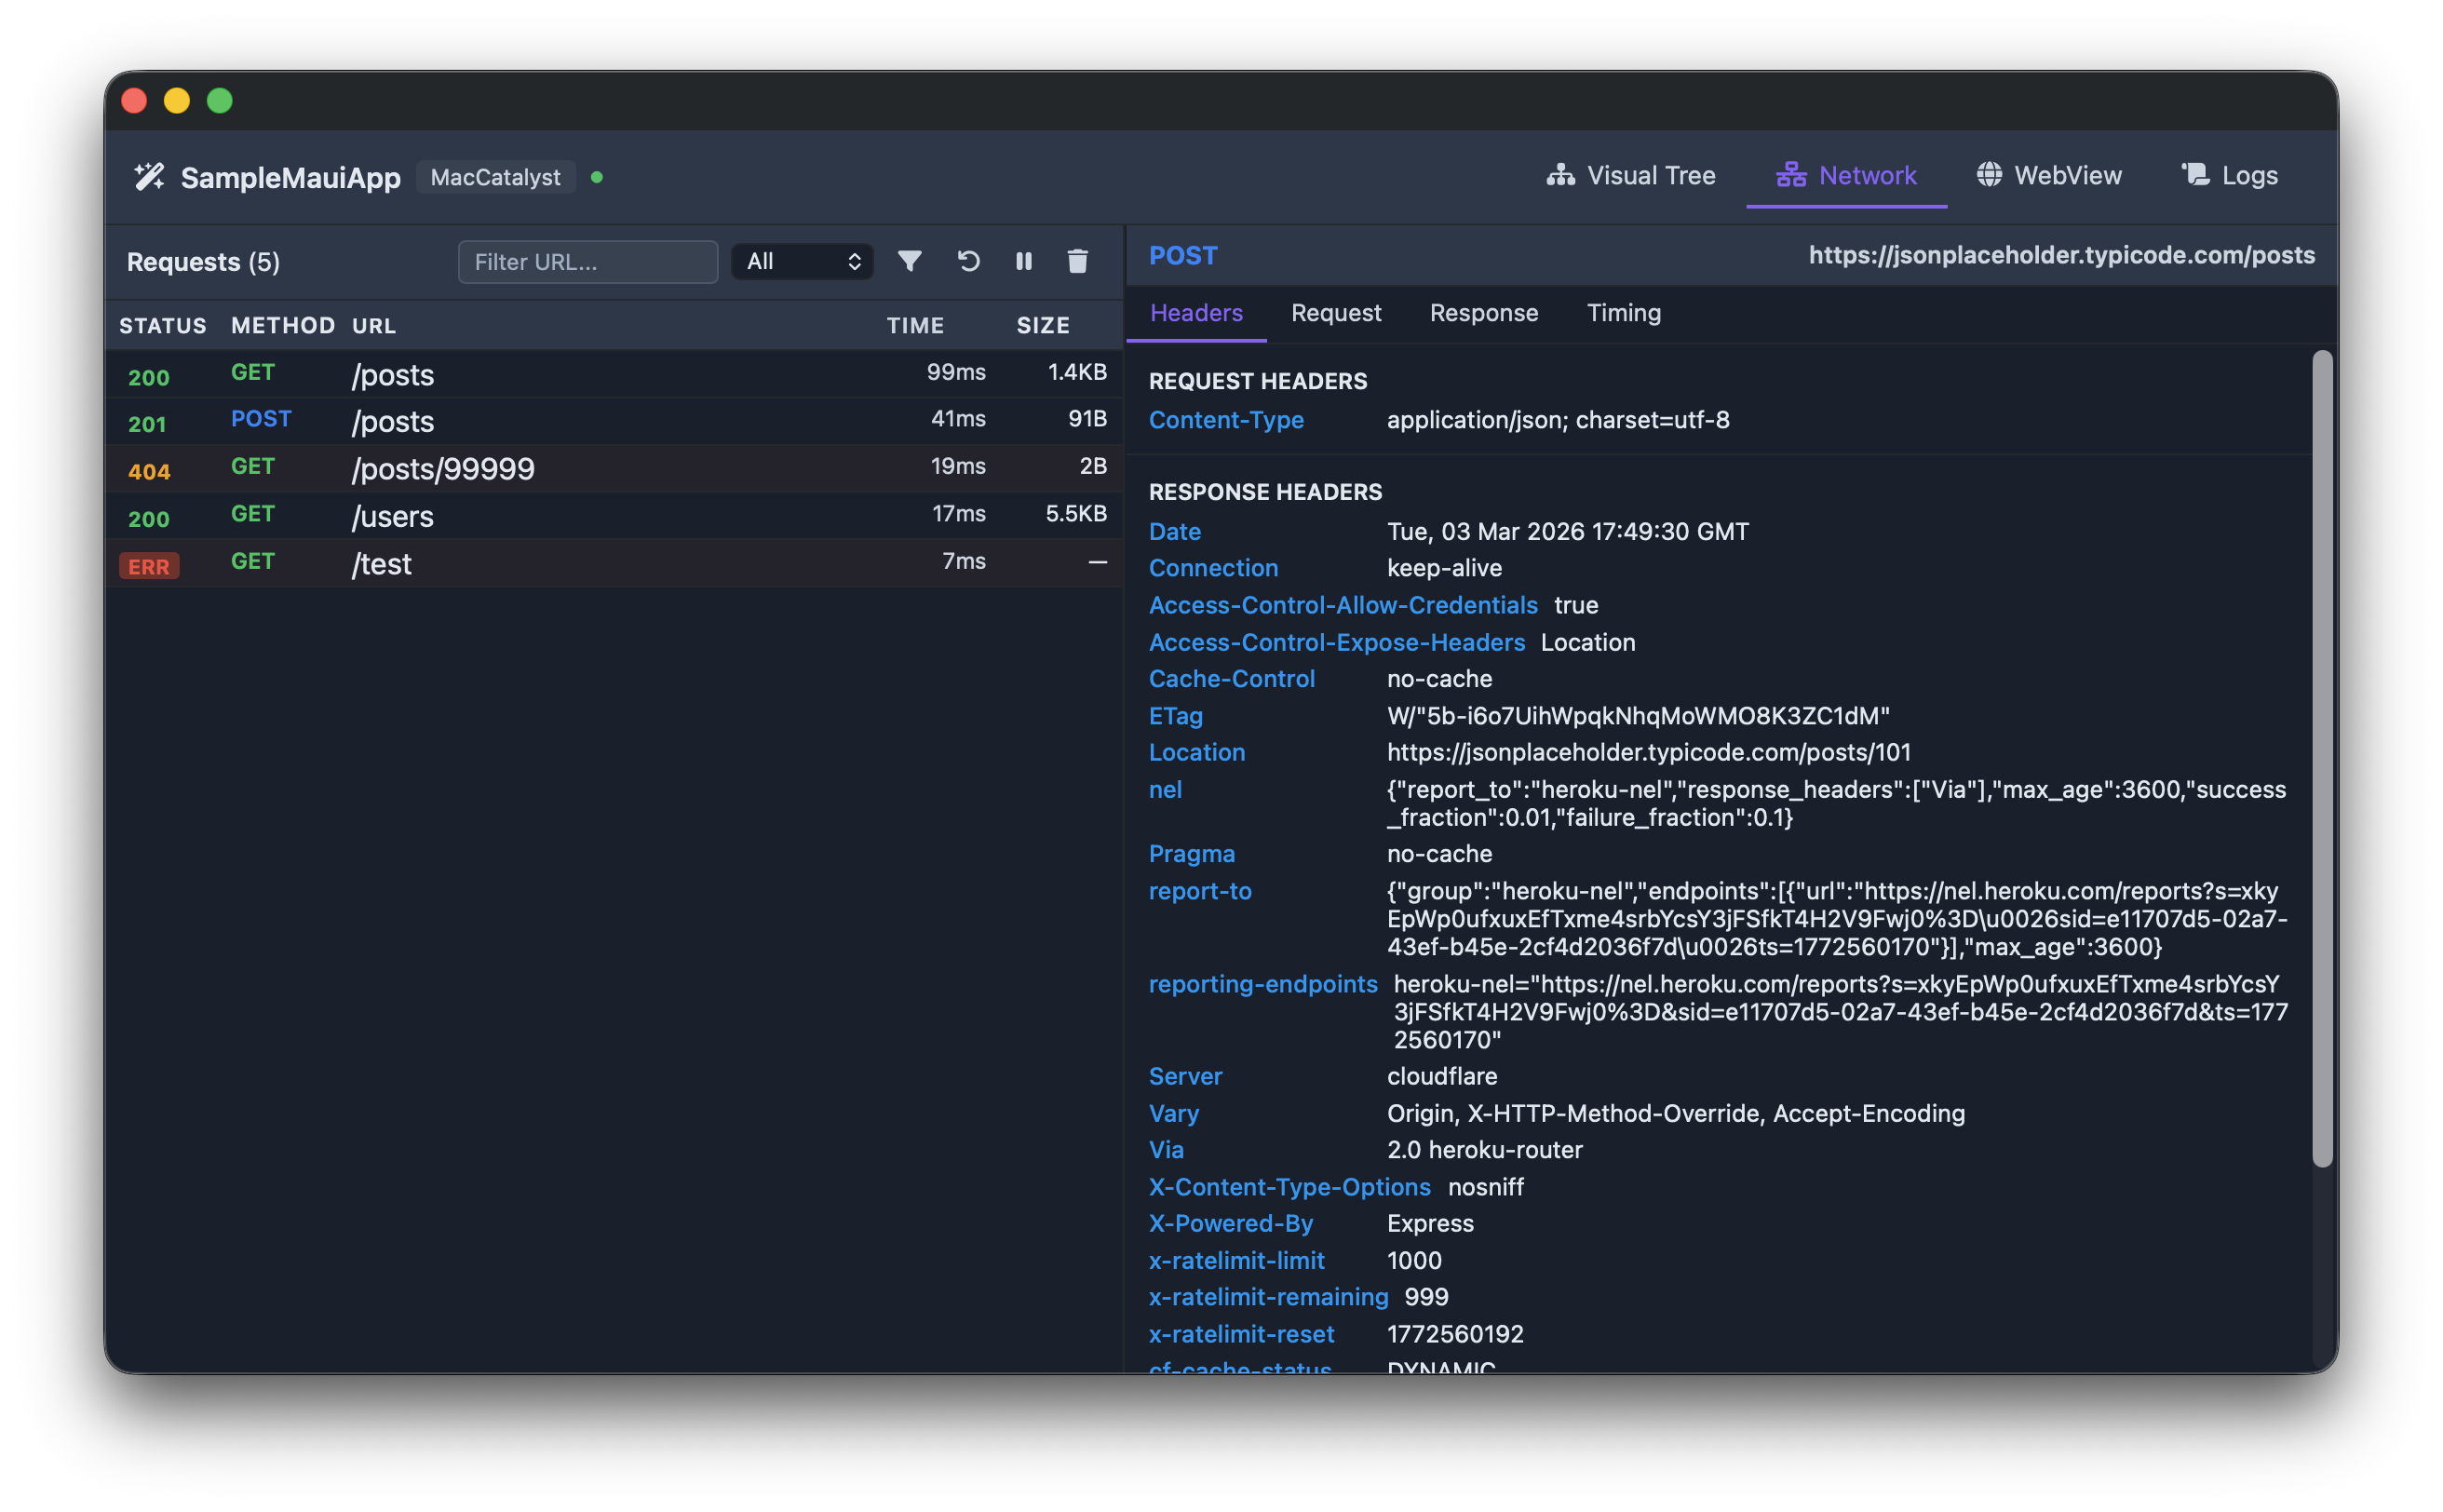
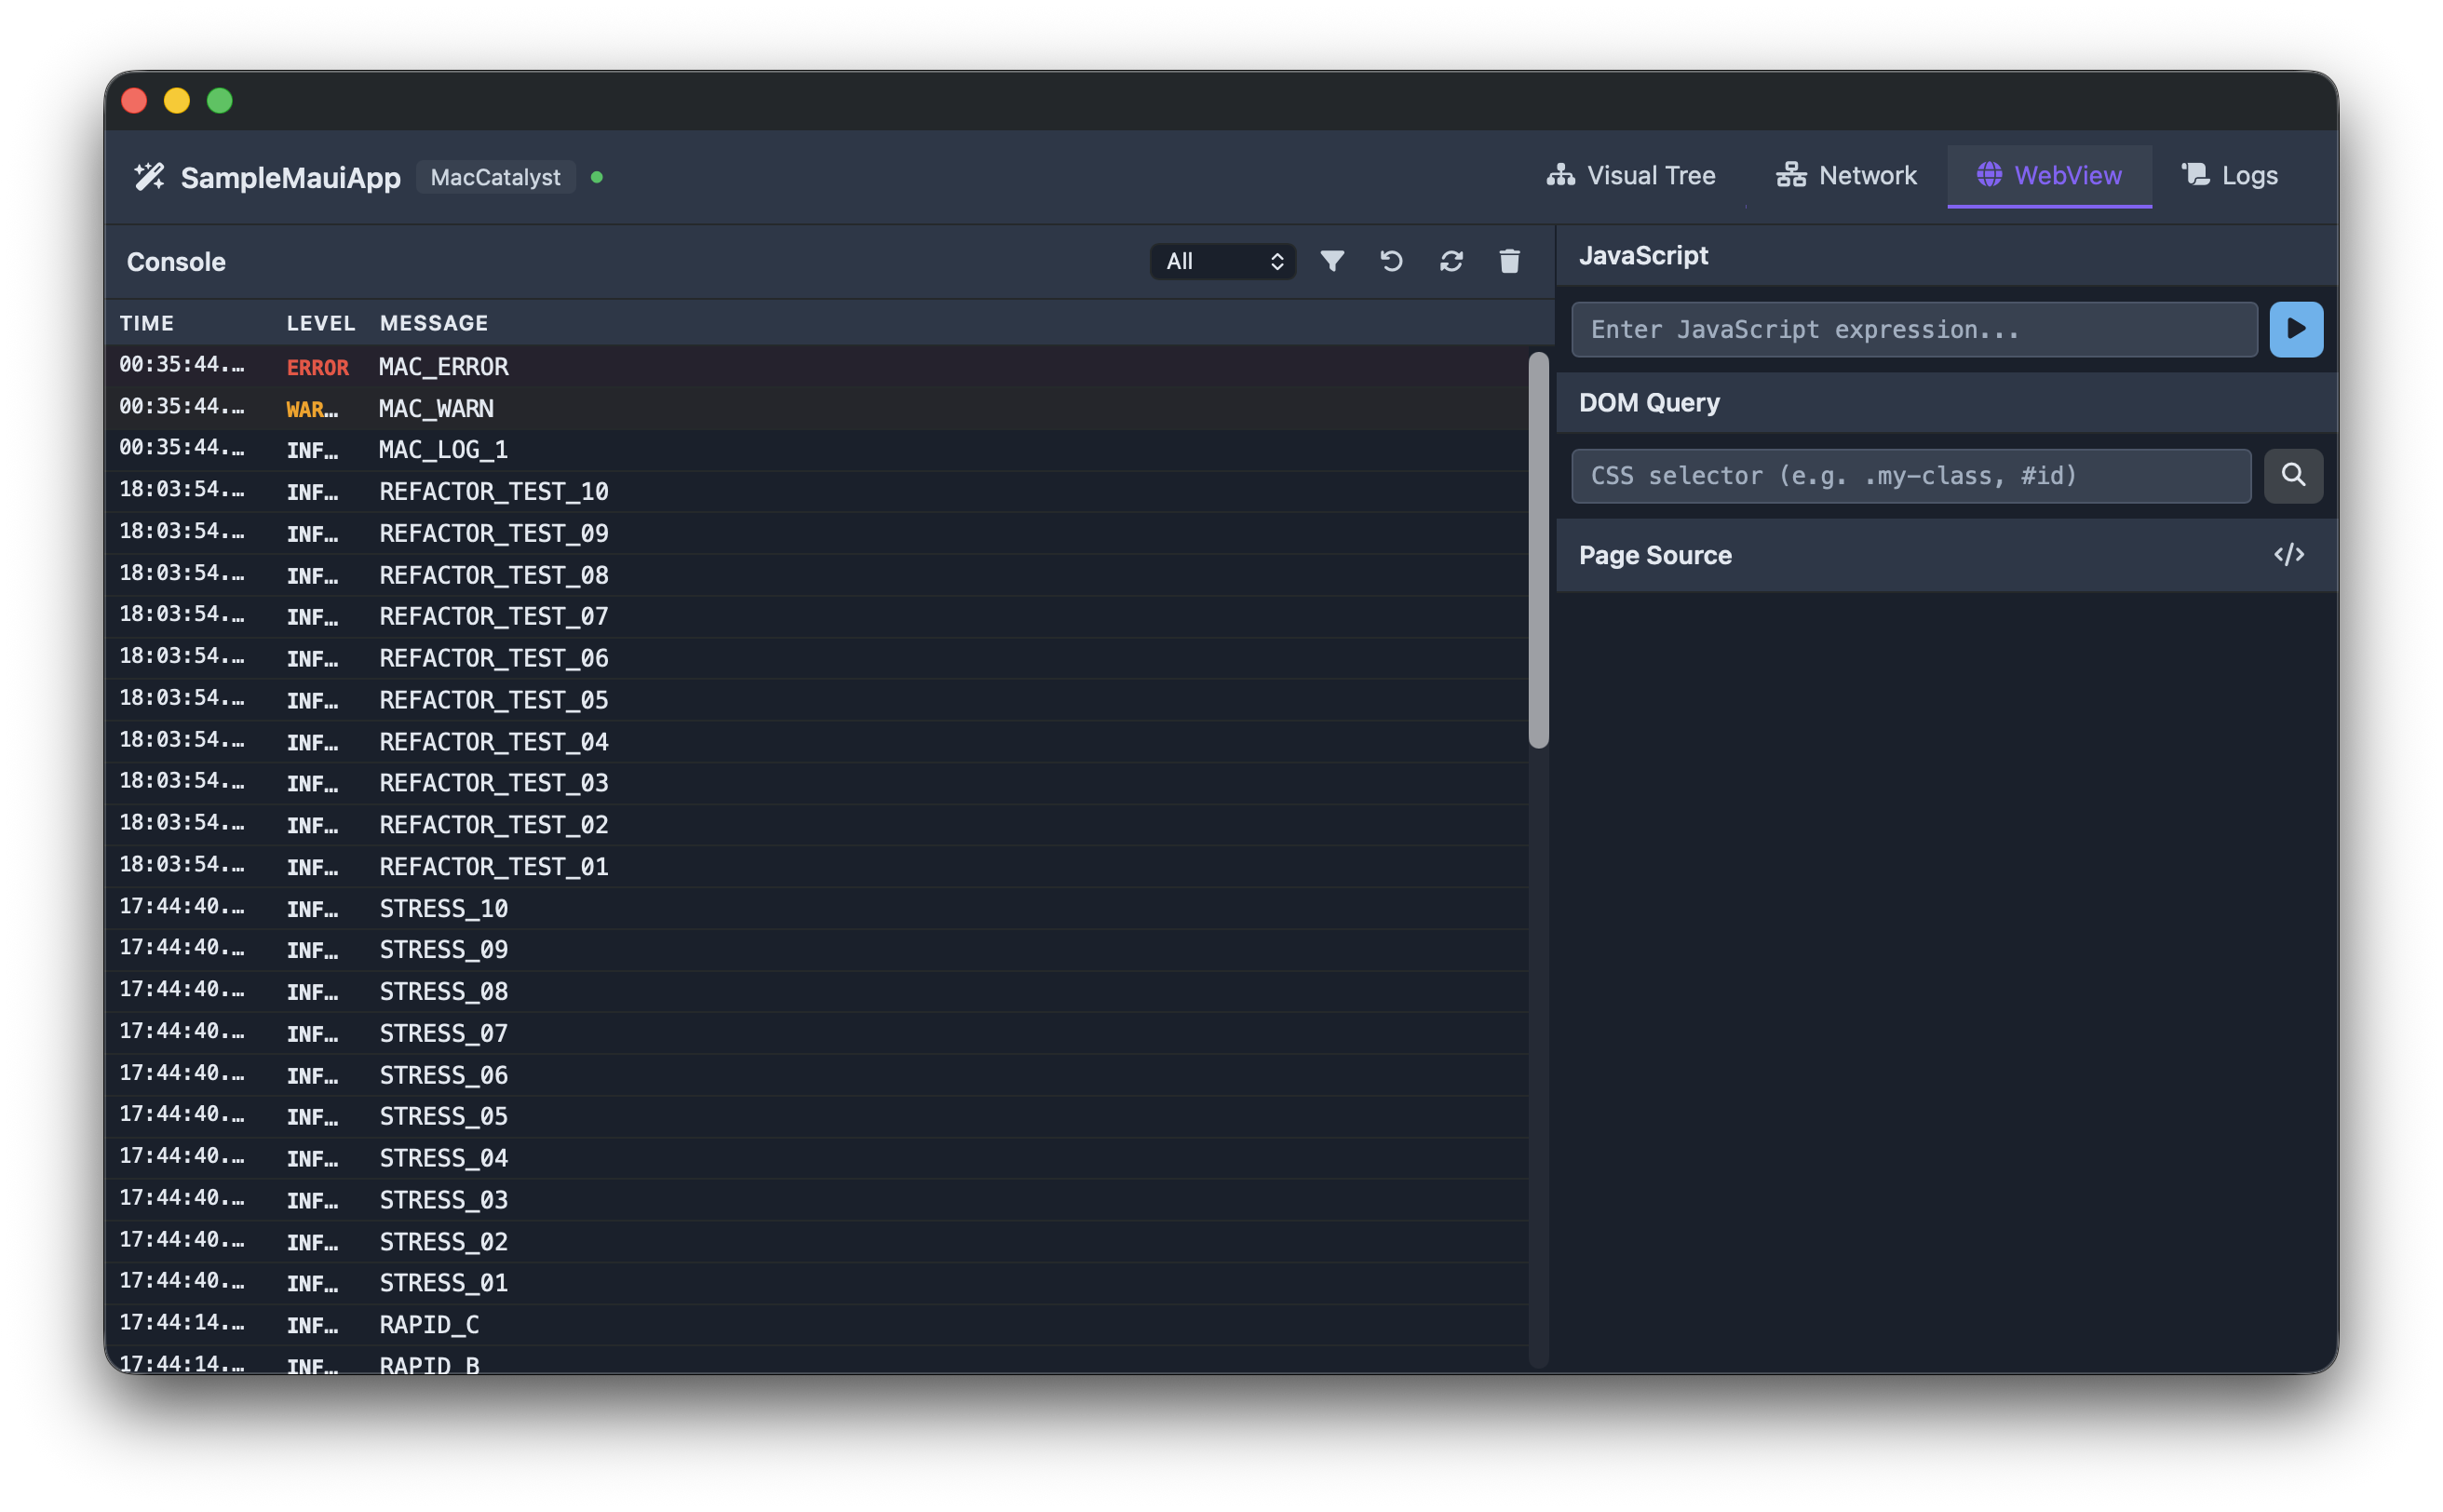
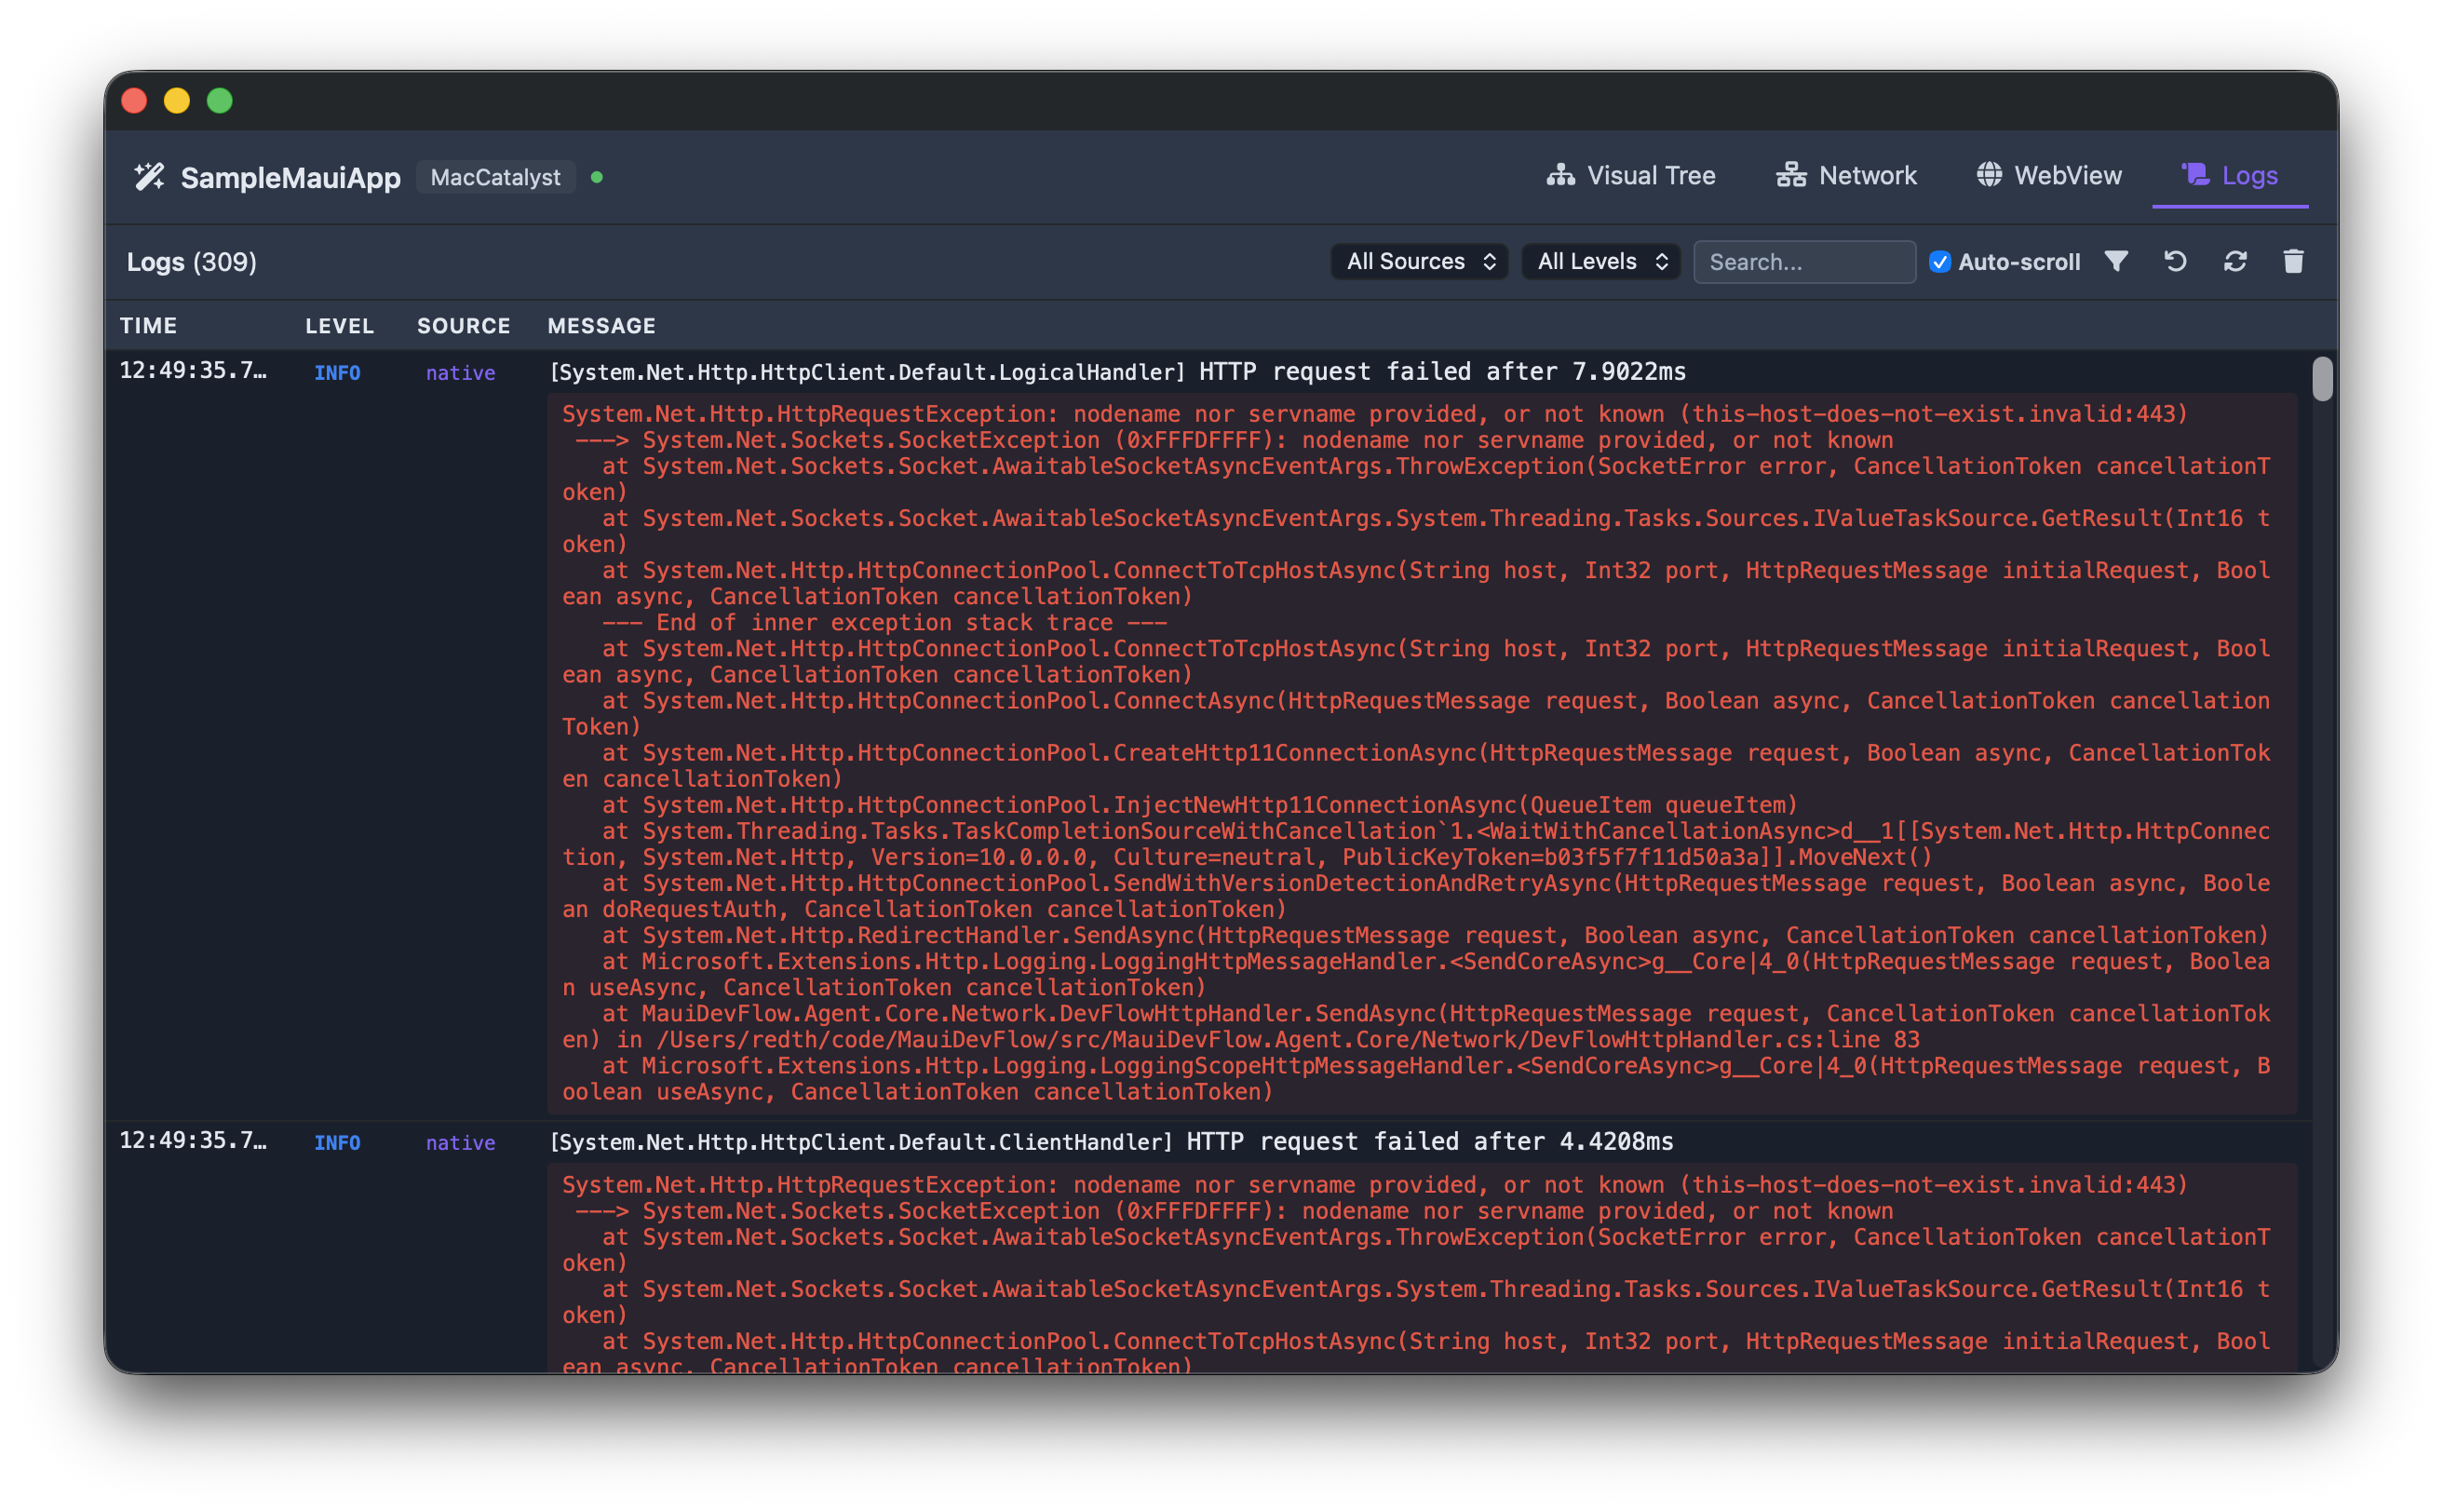
- Click on your app to open the inspector
Android Note
For Android emulators, you'll need to set up port forwarding so the emulator can reach the broker running on your host machine:
adb reverse tcp:19223 tcp:19223Mac Catalyst Note
Mac Catalyst apps need the com.apple.security.network.server entitlement to allow the DevFlow agent to accept connections. Add this to your Entitlements.plist.